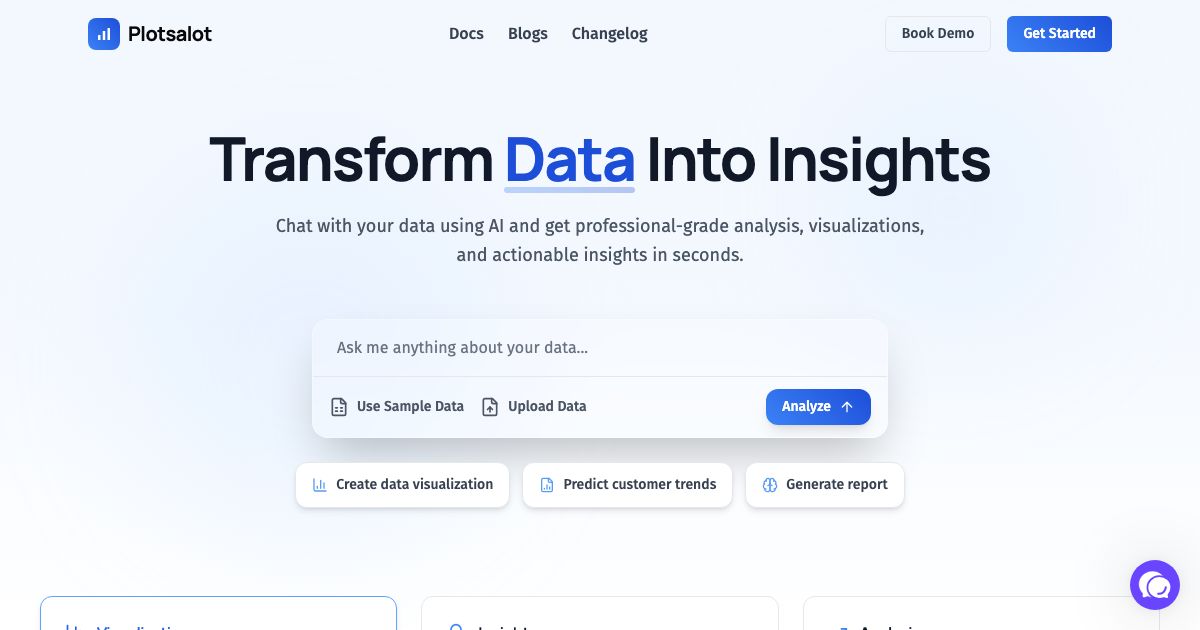
Chat with your data using AI to generate visualizations, insights, and analysis in seconds.
PlotsAlot is an AI-powered data visualization tool that lets users chat with their data in natural language to generate professional-grade charts, analysis, and insights in seconds. It supports CSV, Excel, SPSS, PDF, image, and JSON files, and offers features like auto-refresh, scheduled email reports, one-click data replace, and custom dashboards. Data is encrypted and deleted after one hour of inactivity. Free tier allows 3 messages per month; premium plans offer longer retention and more features.
lightbulbHealthcare analysts upload patient data and ask questions in plain English to uncover trends in treatment outcomes, reducing analysis time from hours to minutes.
lightbulbFinance teams use natural language to detect fraudulent transactions by querying transaction patterns, enabling real-time fraud prevention.
lightbulbResearchers in genetics upload genomic datasets and generate visualizations of gene expression patterns, accelerating hypothesis testing.
lightbulbSociology researchers analyze survey data by asking conversational questions, producing charts that reveal demographic trends for publication.
lightbulbBusiness analysts perform exploratory data analysis on sales data by chatting with the tool, quickly identifying revenue drivers and bottlenecks.
lightbulbMarketing teams connect Google Sheets data and ask for customer segmentation visualizations, enabling targeted campaign planning.
lightbulbEducators upload class performance data and generate grade distribution charts in seconds, saving hours of manual chart creation.
lightbulbStudents use the free tier to visualize experimental data for lab reports, creating publication-ready figures without coding.
AIdata visualizationnatural languageanalyticschartsinsightsautomationreporting